What is Random Vibration Analysis?
Random vibration refers to vibrations whose frequency and amplitude vary randomly over time and cannot be predicted. This type of vibration typically originates from environmental effects. It aims to determine certain statistical characteristics of a structural response — usually the standard deviation (1σ) of displacement, force, or stress. It uses the mode superposition method and is a linear analysis.

PSD / Power Spectral Density
If the amplitude is continuously changing, how can a random excitation be evaluated?
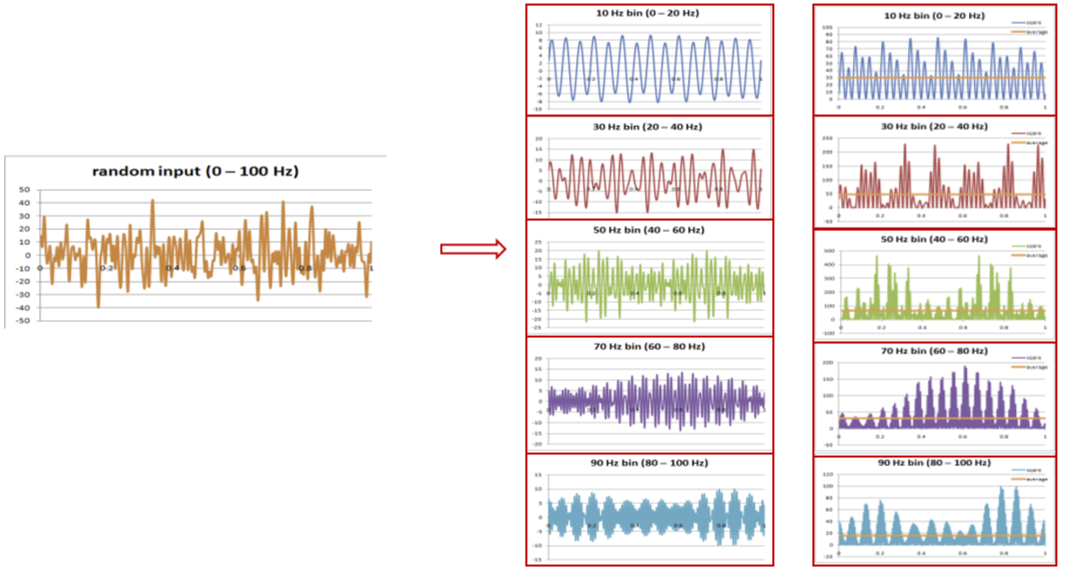
In random vibration, analyzing the instantaneous amplitude in the time domain is not meaningful.
Since both amplitude and frequency continuously change, the time domain appears complex and chaotic. Therefore, the analysis is performed in the frequency domain instead.
In such analyses, Power Spectral Density (PSD) is used.
PSD represents the energy density of the vibration with respect to frequency.
RMS / Root Mean Square
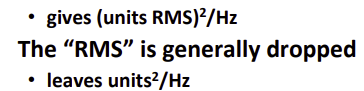
RMS stands for Root Mean Square. It represents the average value of the input signal. It corresponds to the RMS value under the PSD curve.
RMS / Root Mean Square
PSD
 | |||
 | |||
Fourier Transform (FFT)
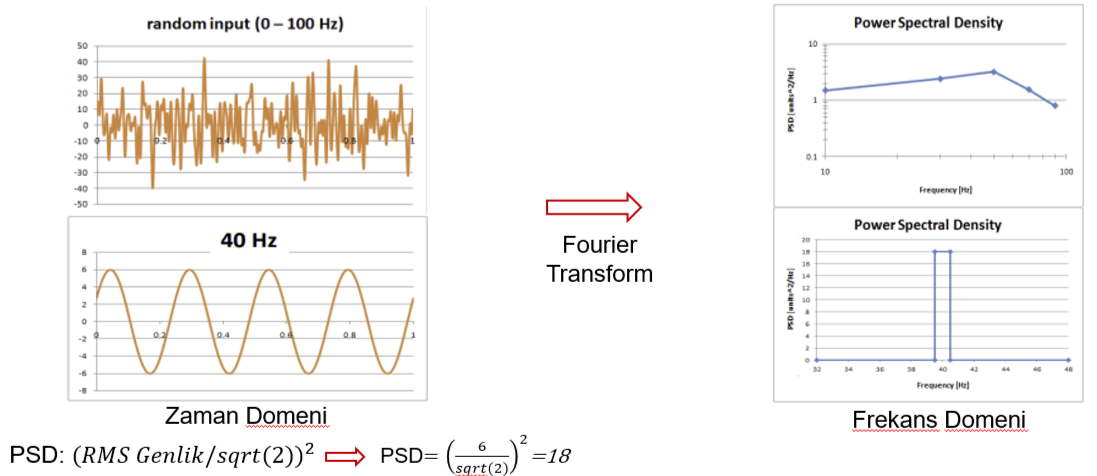
Fourier Transform is a mathematical tool that decomposes a time-varying signal into its constituent frequencies.
In other words, it takes a signal and reveals which frequencies are present and how strong they are.
Difference Between PSD and FFT
| Feature | FFT | PSD |
|---|---|---|
| What does it do? | Time-domainFrequency-domain | Measures power density |
| Output unit | Amplitude (Complex) | Unit²/Hz |
| Purpose of use | To find frequency components | To measure the frequency distribution of energy |
| Application area | Signal analysis, spectrum analysis | Random vibration, load spectra |
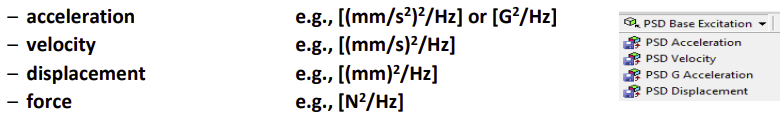
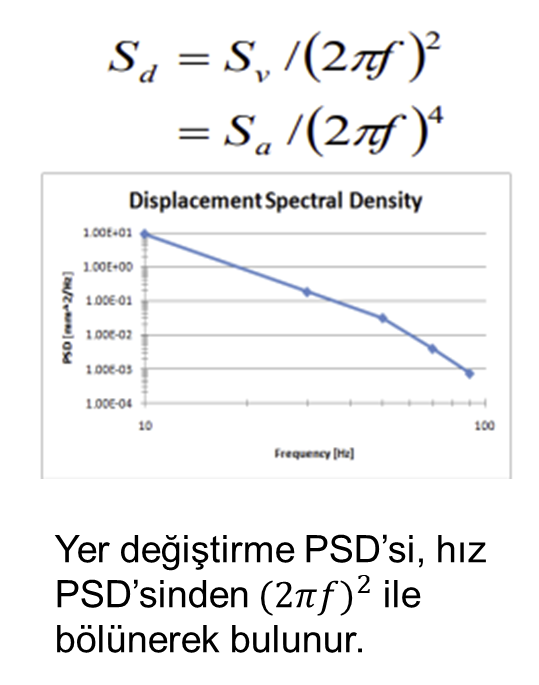
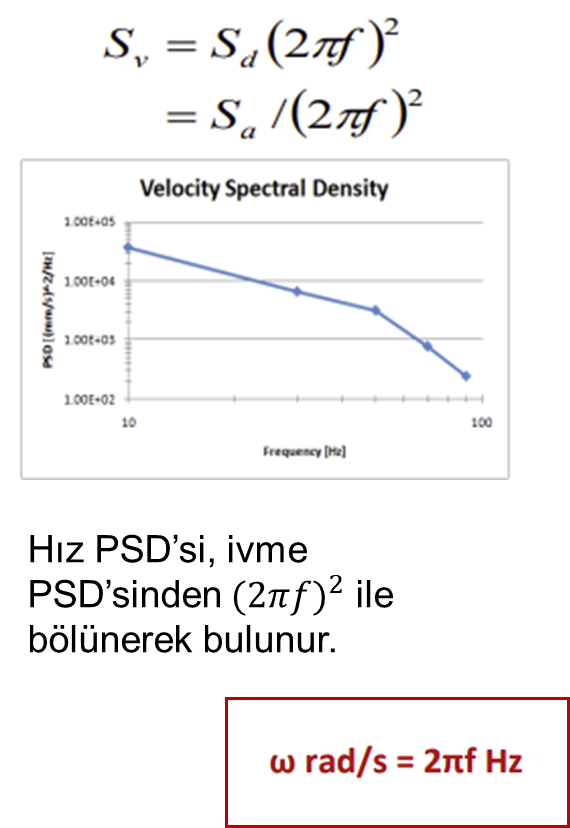
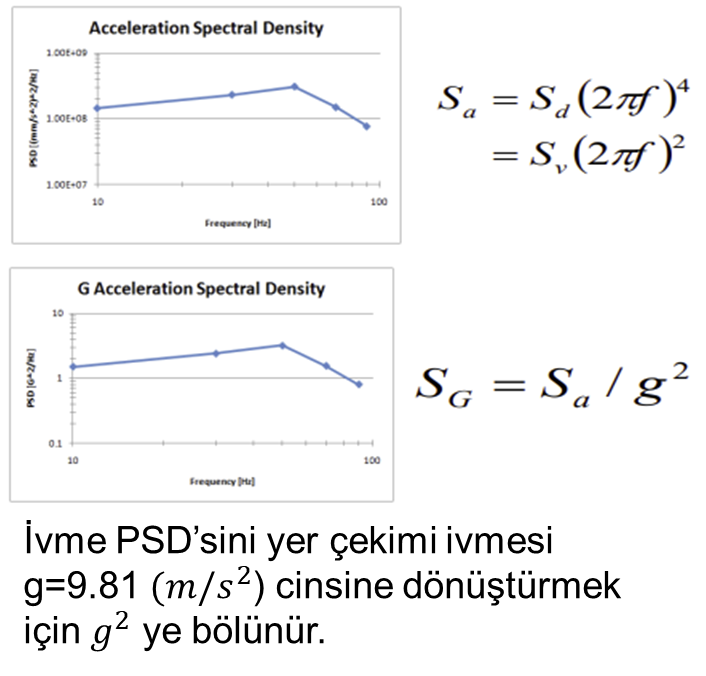
Acceleration, Velocity, and Displacement Spectrum Transformations
Excitation Distribution
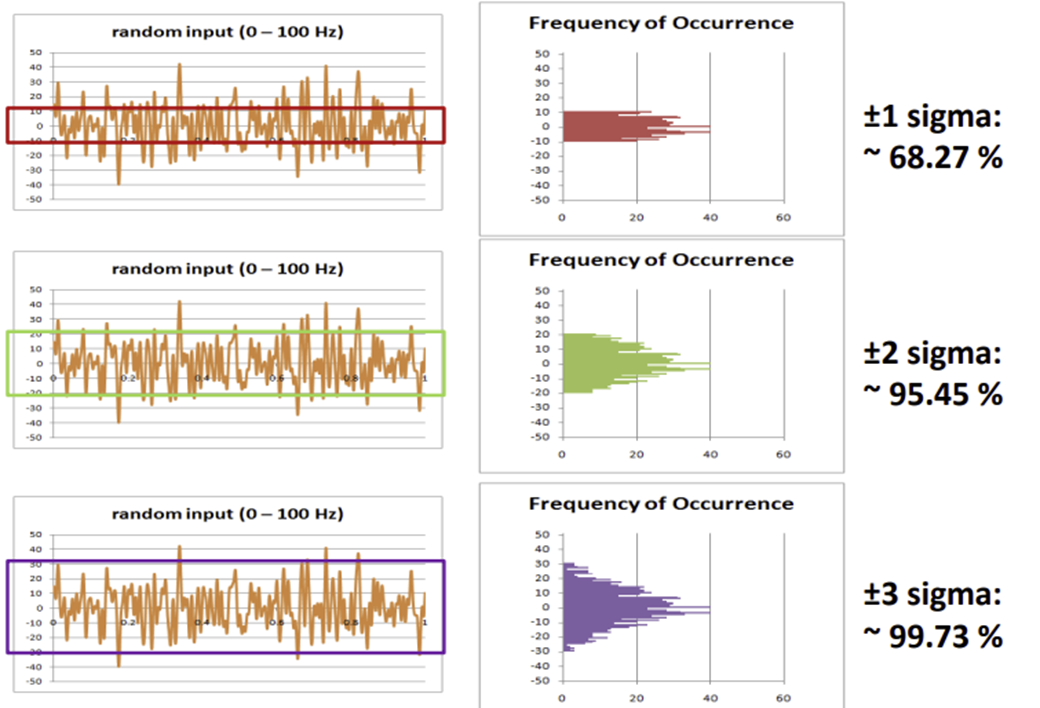
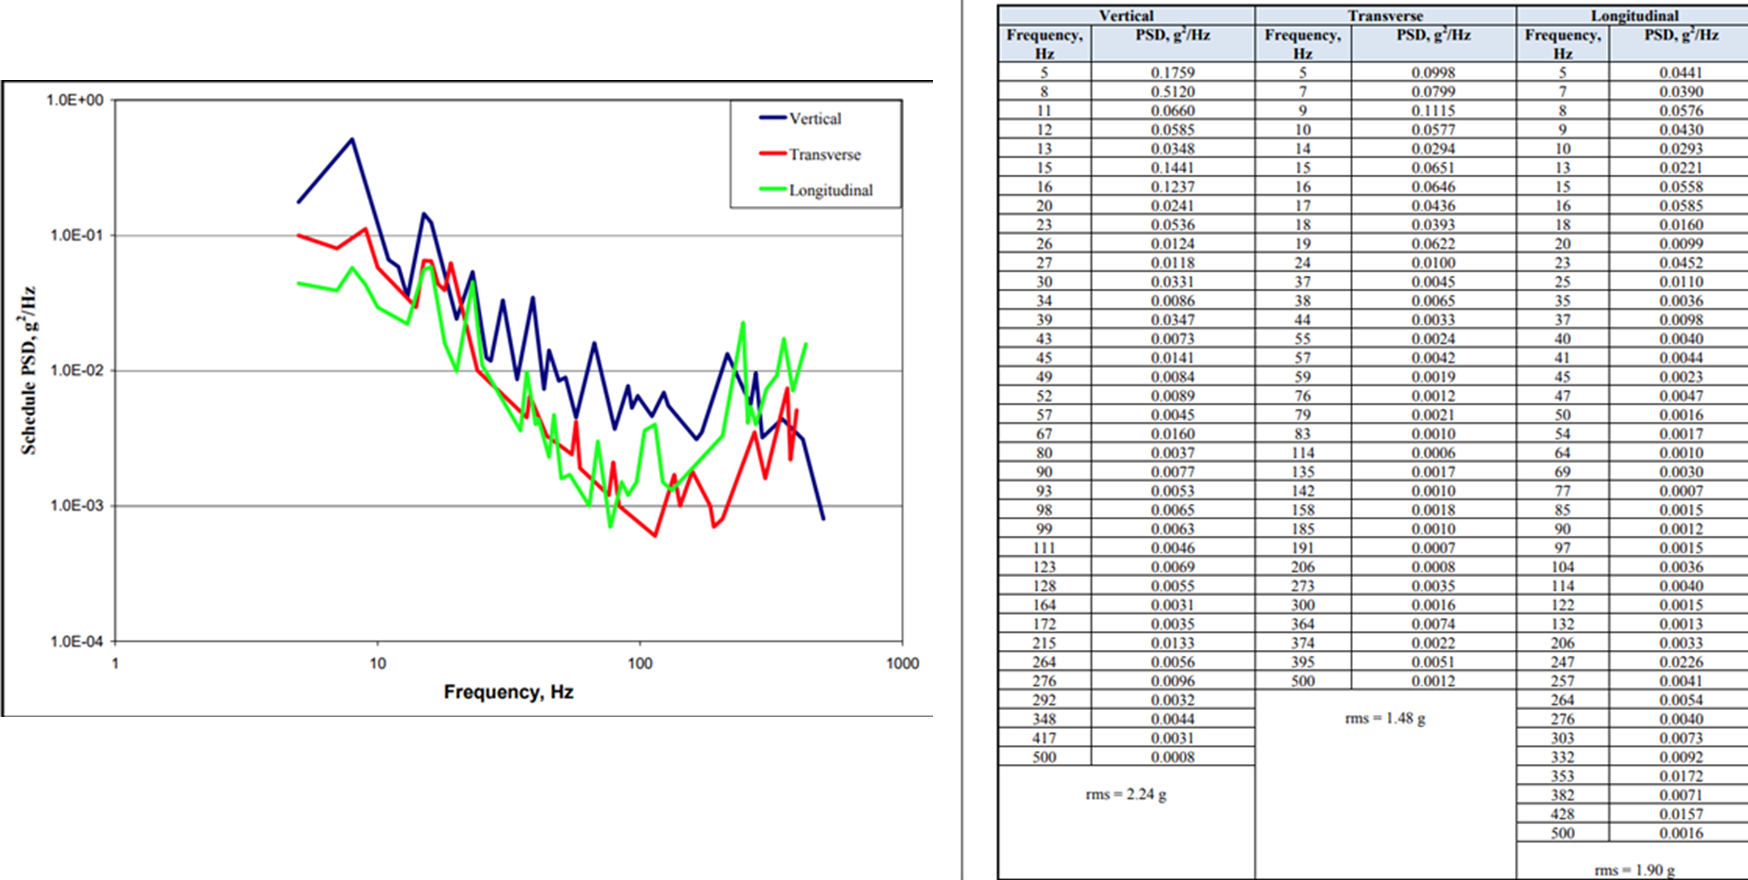
In random vibration analyses, the input signal is typically represented by a normal (Gaussian) distribution. This allows random inputs to be statistically characterized.
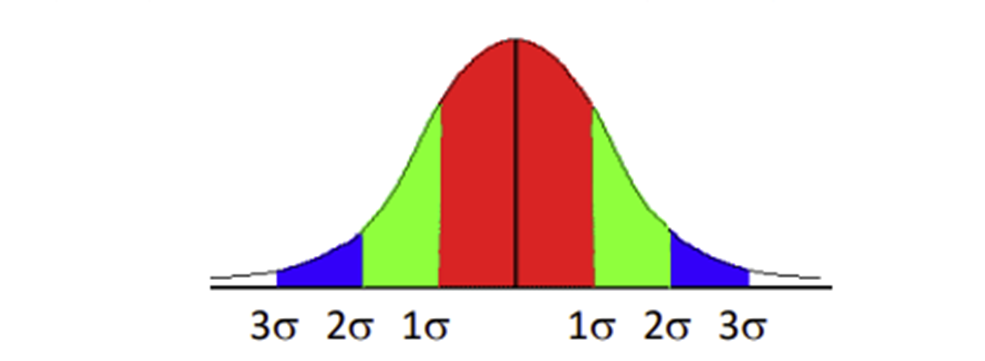
| Standard Deviation | Occurrence Percentage | Cumulative Occurrence Percentage |
|---|---|---|
| 1-sigma | 68.3% | 68.3% |
| 2-sigma | 27.1% | 95.4% |
| 3-sigma | 4.33% | 99.73% |
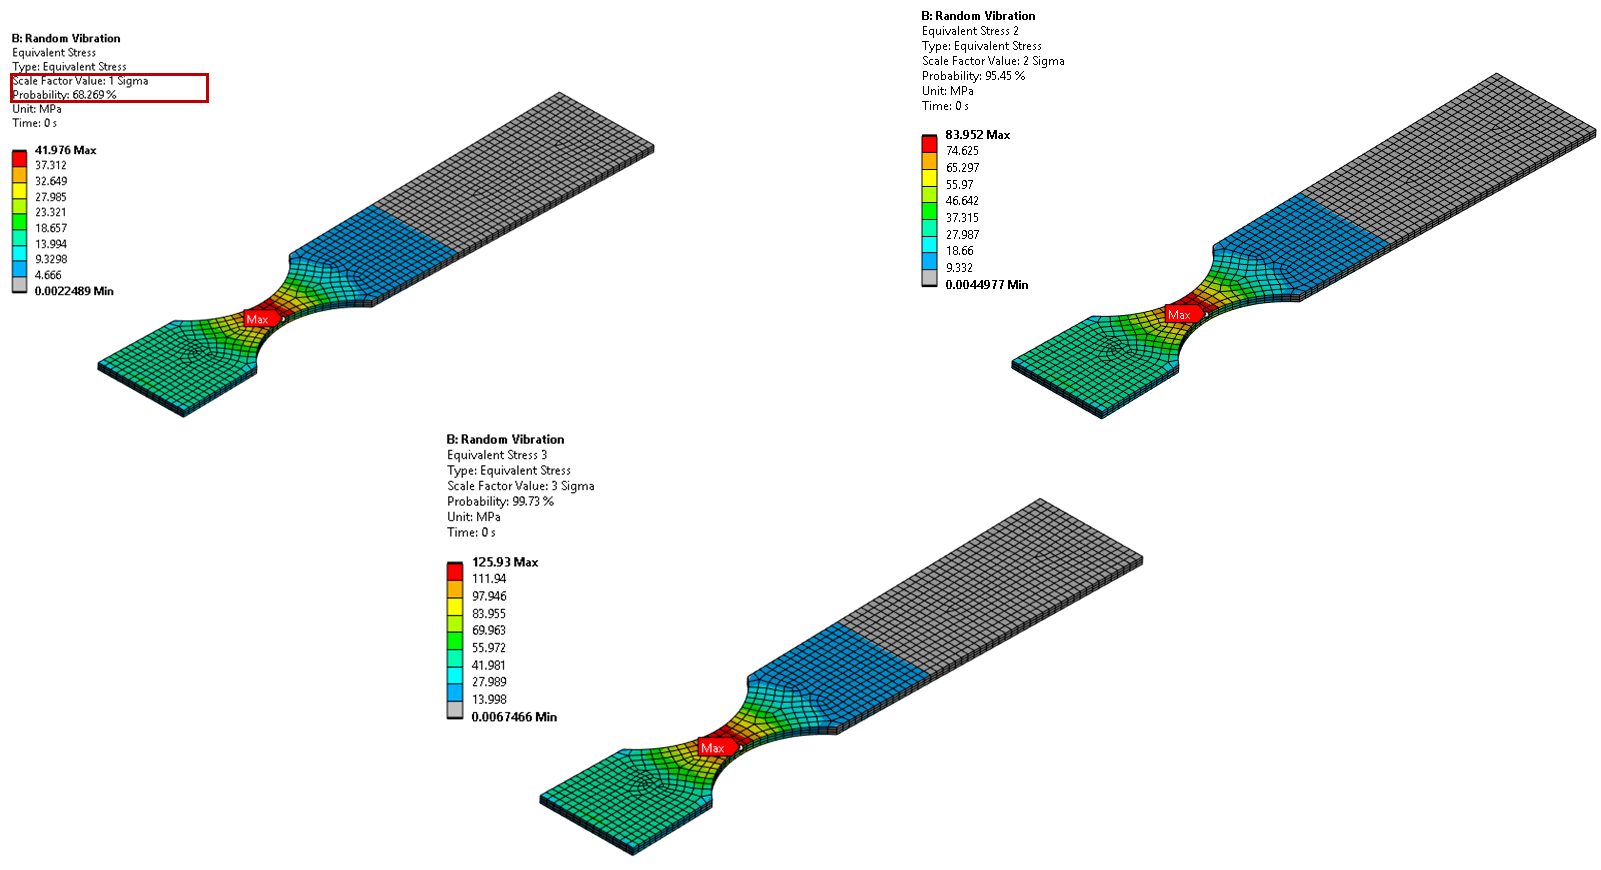
The 1σ, 2σ, and 3σ stress values obtained from the PSD analyses represent the stress levels that the part may encounter throughout the vibration data. Since a normal distribution is assumed, it is impossible to account for 100% of all possible excitations. Moreover, high-sigma excitations occur very rarely. Therefore, using 3-sigma as the upper limit is common practice.
RPSD (Response Power Spectral Density)
Response PSD provides the spectral response of a structural component subjected to a random excitation.
When a response PSD probe is placed, the Response PSD is plotted as the square of the spectral response over the excitation frequency range.
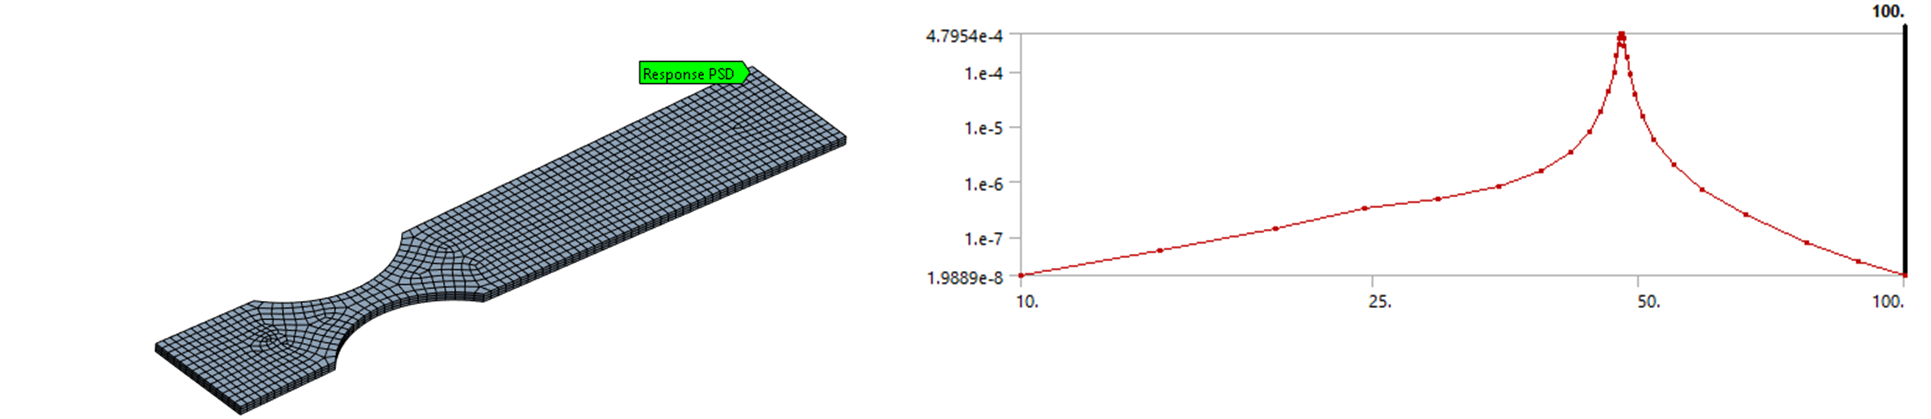
PSD What the structure is loaded with (input)
RPSD How the structure responds (output)
PSD Curve
Once the load data is entered, the graph provides one of the color-coded indicators for each segment.
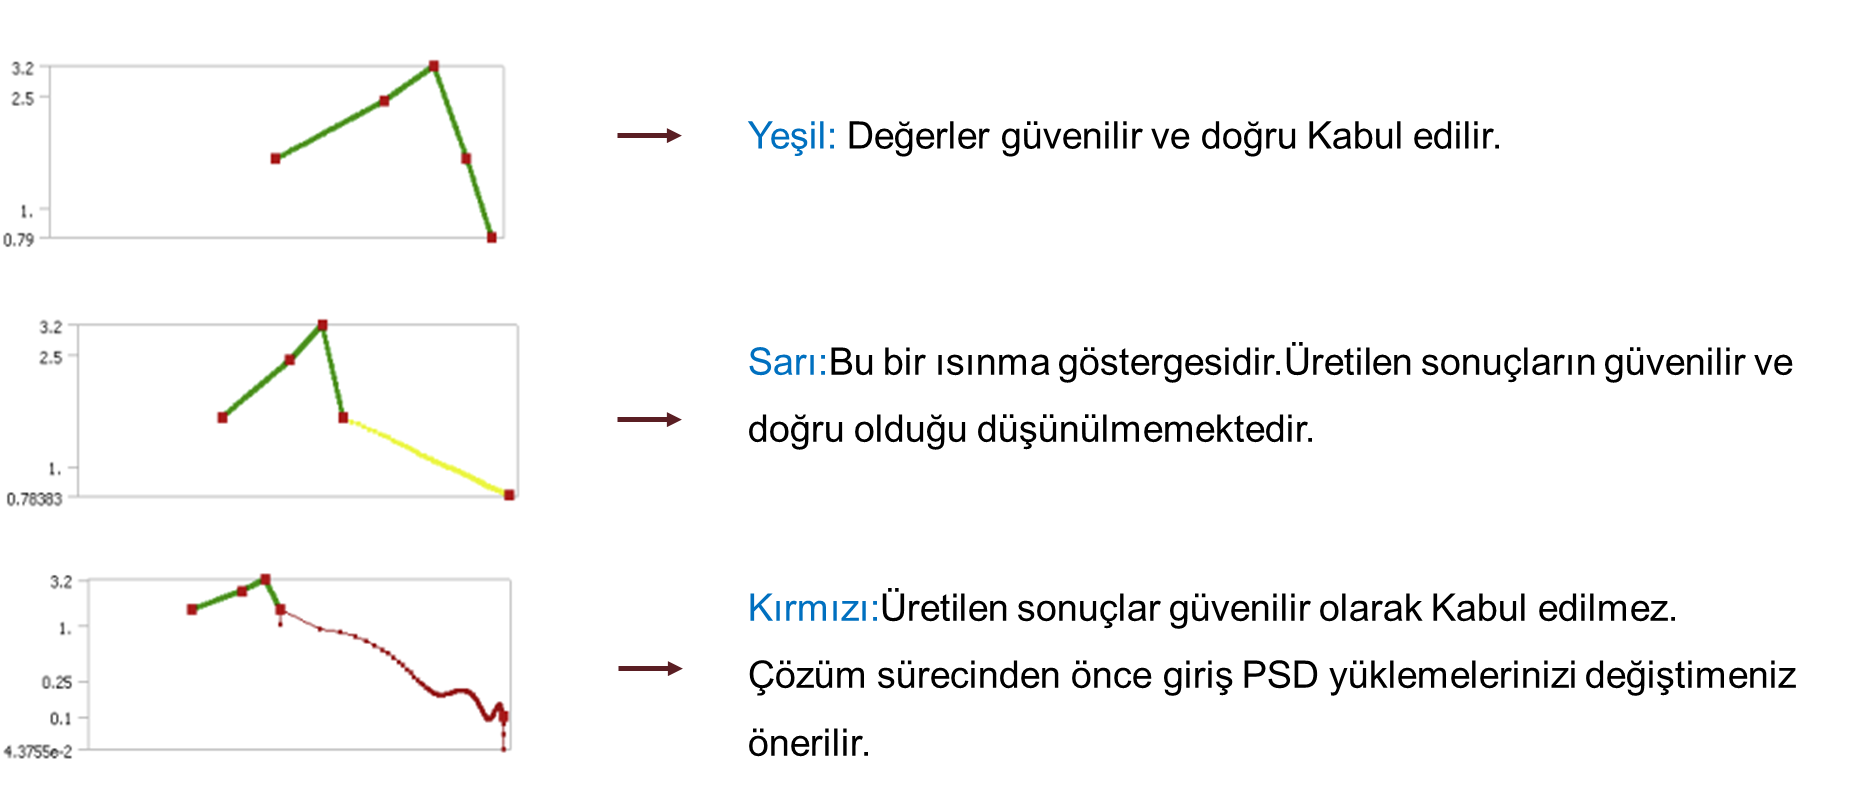
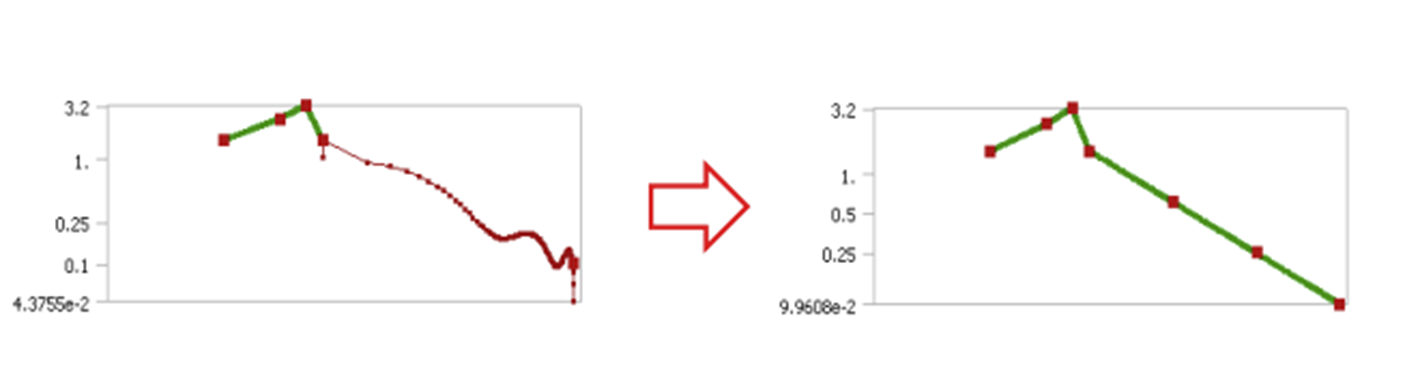
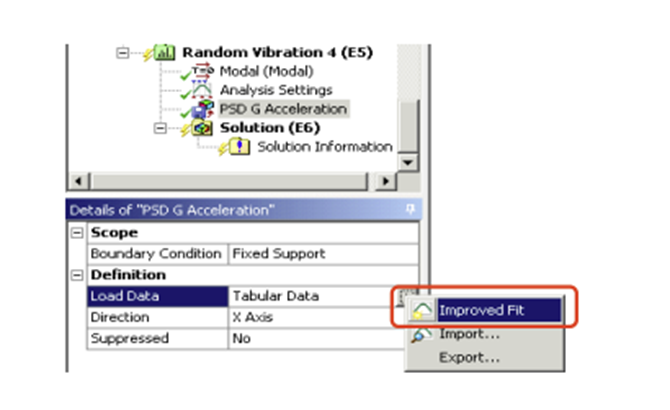
If we want to shift the PSD curve from the red, unreliable region to the green, reliable area, there is a command available to improve this region. The graph of the input PSD is automatically evaluated by the software. For the PSD input, the PSD values between consecutive points should not vary by more than one order of magnitude.
In modal analysis, all modes within the range of 0 to 1.5 times the maximum frequency defined in the input PSD must be extracted.
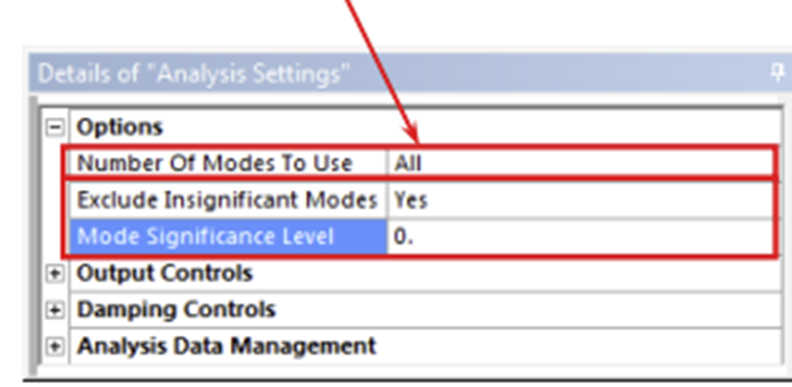
Under the analysis settings in random vibration analysis, the number of modes to be used should be set to "all."
By default, displacement responses are calculated.
To include velocity or acceleration responses, the corresponding output controls must be set to "Yes."
PSD-Based Fatigue Analyses
Fatigue
In general, there are two approaches to calculate the fatigue life of a structure subjected to cyclic loading.
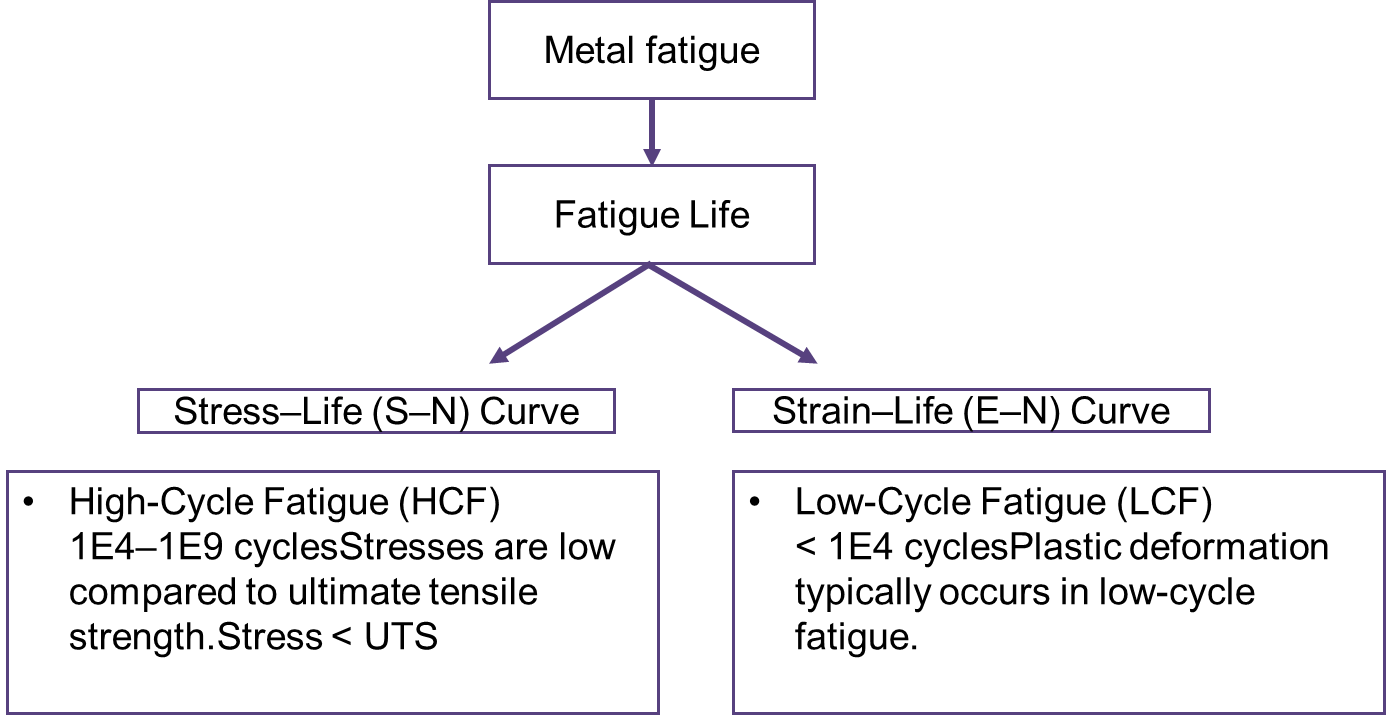
FATIGUE
Under static or quasi-static loading conditions, fatigue analysis is performed based on the stress-life method, using the equivalent von Mises stress value as the basis.
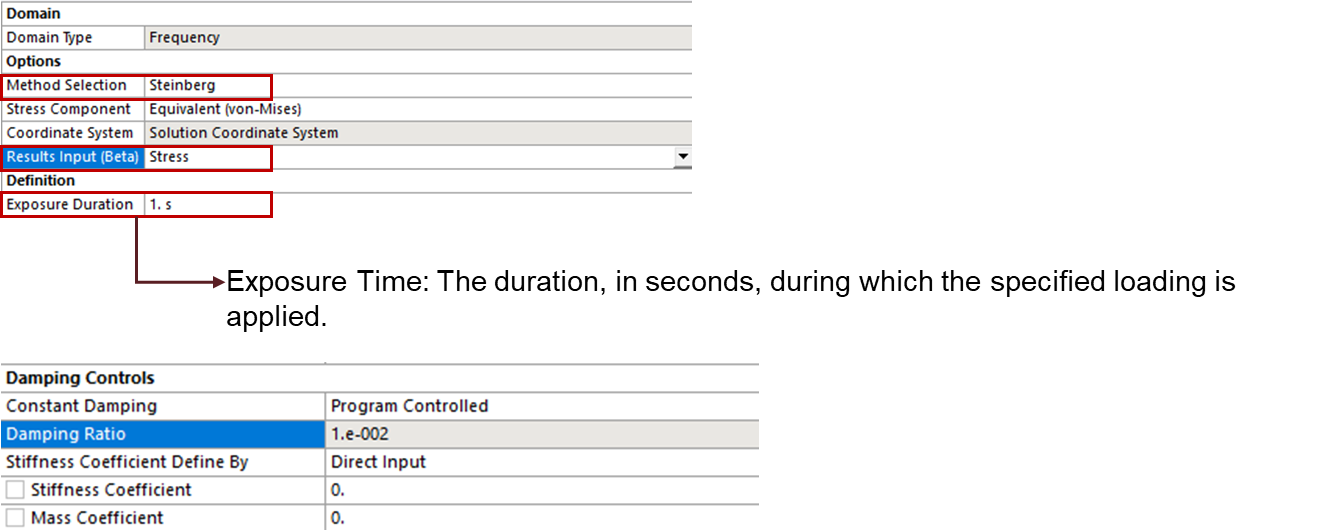
For fatigue analysis due to random vibration, the Steinberg method is used based on the stress-life method.